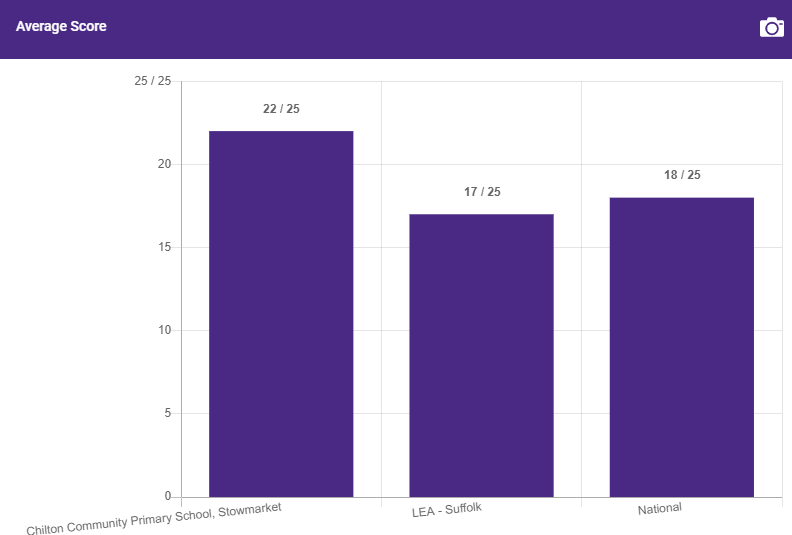
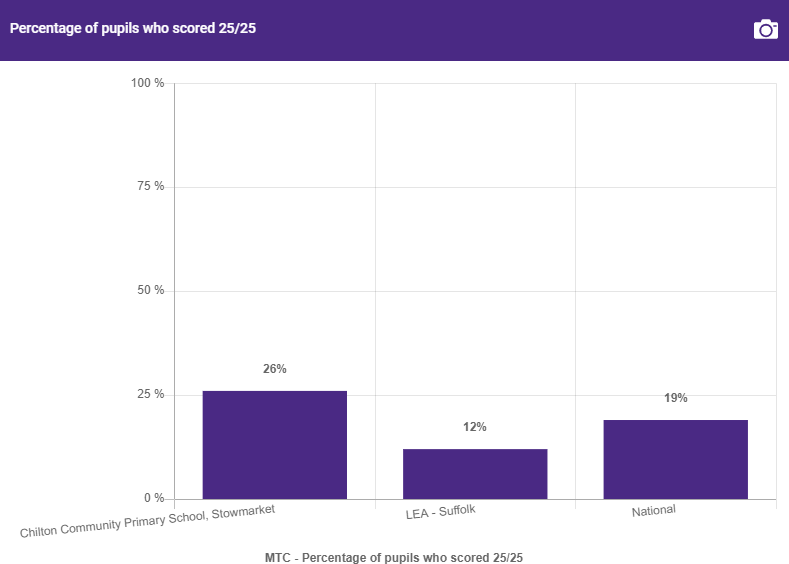
Ofsted & Performance Data
OFSTED
The school became an academy on 1st May 2020 so it has no current OFSTED reports.
Parent View
Chilton Community Primary School Parent View
Please click on the above link if you would like to complete this questionnaire.
School performance tables
Please click on link below to view our data:
School performance table comparison
Swimming report
|
Meeting national curriculum requirements for swimming and water safety |
Percentage of pupils achieving: |
|
What percentage of your Year 6 pupils could swim competently, confidently and proficiently over a distance of at least 25 metres when they left your primary school at the end of last academic year?
|
2018 71% 2019 73%
|
|
What percentage of your Year 6 pupils could use a range of strokes effectively [for example, front crawl, backstroke and breaststroke] when they left your primary school at the end of last academic year? |
2018 73% 2019 73% |
|
What percentage of your Year 6 pupils could perform safe self-rescue in different water-based situations when they left your primary school at the end of last academic year? |
2018 60% 2019 70% |
|
Schools can choose to use the Primary PE and Sport Premium to provide additional provision for swimming but this must be for activity over and above the national curriculum requirements. Have you used it in this way? |
No |
Key Stage 2 SATS Results
There is no data for 2020 due to Covid 19. The school became an academy on 1st May 2020 so there is no data available prior this date.
Progress score for reading, writing and maths for 2020/21 KS2 using 2018 calculator
| Reading | Writing | Maths |
|
Well Above Average
+ 5.97 |
Above Average
+ 2.71 |
Average
+ 2.24 |
2 Review of the end of Key Stage 1 outcomes for 2021, based on 2019 SATs
|
Key Stage 1 (This year’s Year 2) Number of pupils = |
Outcomes – all pupils |
Outcomes – disadvantaged pupils |
|
% at or above the expected standard in reading (2019 Nat Av = 75%) |
62% |
40% |
|
% at or above the expected standard in writing (2019 Nat Av = 69%) |
67% |
60% |
|
% at or above the expected standard in maths (2019 Nat Av = 76%) |
67% |
40% |
|
% at or above expected standard in reading, writing and maths combined (2019 Nat Av = 65%) |
58% |
40% |
|
% at expected standard in science, based on teacher assessment |
60% |
44% |
|
% at greater depth in reading (2019 Nat Av = 25%) |
6% |
0% |
|
% at greater depth in writing (2019 Nat Av = 15%) |
6% |
0% |
|
% at greater depth in maths (2019 Nat Av = 22%) |
11% |
0% |
|
% at greater depth in reading, writing and maths combined (2019 Nat Av = 11%) |
6% |
0% |
Commentary, including progress from the end of EYFS:
3 Review of the end of Key Stage 2 outcomes for 2021, based on 2019 SATs
|
Key Stage 2 (this year’s Year 6) Number of pupils = |
Outcomes – all pupils |
Outcomes – disadvantaged pupils |
|
% at or above expected standard in reading (2019 Nat Av = 73%) |
57% |
50% |
|
% at or above expected standard in writing (2019 Nat Av = 78%) |
52% |
33% |
|
% at or above expected standard in maths (2019 Nat Av = 79%) |
57% |
50% |
|
% at or above expected standard in reading, writing and maths combined (2019 Nat Av = 65%) |
35% |
16% |
|
% at expected standard in science, based on teacher assessment |
53% |
36% |
|
% at high standard in reading (2019 Nat Av = 27%) |
0% |
0% |
|
% at greater depth in writing (2019 Nat Av = 20%) |
4% |
4% |
|
% at high standard in maths in (2019 Nat Av = 27%) |
0% |
0% |
|
% at high standard in reading, writing and maths combined in July (2019 Nat Av = 11%) |
0% |
0% |
Commentary, including progress from the end of Key Stage 1:
4 Review of outcomes and progress in other cohorts
EYFS (2019 GLD Nat – 72%)
66%
Year 1 Phonic Screening (2019 Yr 1 Nat = 82%)
70%
Year 2 Phonics – Autumn Term
100%
Year 2 Phonics Rechecks – Summer Term
100%


